 TFStudio
 Measuring the n and k of your own film
Get n, k and thickness for a film your own chamber deposited, from a spectrophotometer scan or an ellipsometer pair, and save it as a material.
A witness slide comes out of the chamber with one layer on it, and the scan is on your screen.
How much of n, k and d does that scan actually determine?
A film thick enough to show fringes determines all three. Below about a quarter wave, n and d enter R and T almost only as their product, so a fit can sit on the scan point for point with the wrong pair of numbers in it.
n,k Characterization takes the R and T you measured on that witness, or a Ψ and Δ pair, and works out the n, k and thickness of the layer, so you can design with the material your chamber actually deposits.
What this module models
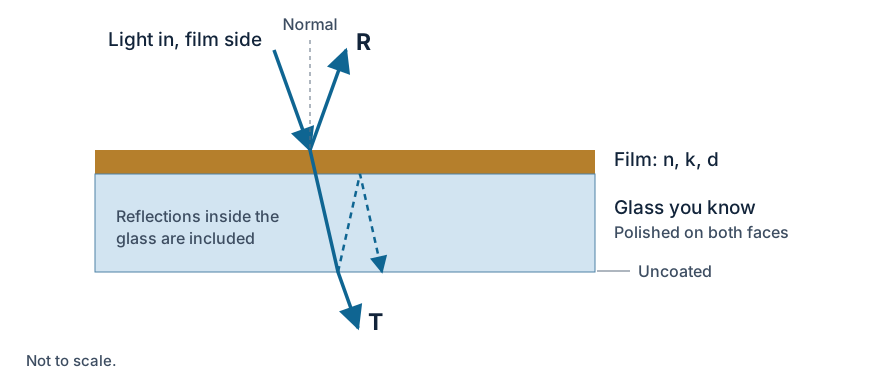
A substrate polished on both sides, with a single layer deposited on one of its faces. The reflection off the uncoated face is part of the calculation, so the T you give it has to be the light leaving the whole slab.
If that face is badly wedged, blackened or unpolished, do not trust the result. Blackening removes a rear reflection worth about four percentage points on glass. A ground face scatters light instead of absorbing it, so on an integrating sphere in total mode n and thickness still come out right, but k does not: light that scatters away and never reaches the detector looks the same as absorption in the film.
Import the scans
Measure absolute R and T over the same wavelengths and import both files in Production → Measured data → Spectra.

For this example measurements of a 300 nm thick SiO2 film on a 8 mm thick BK7 (Schott) glass were loaded:
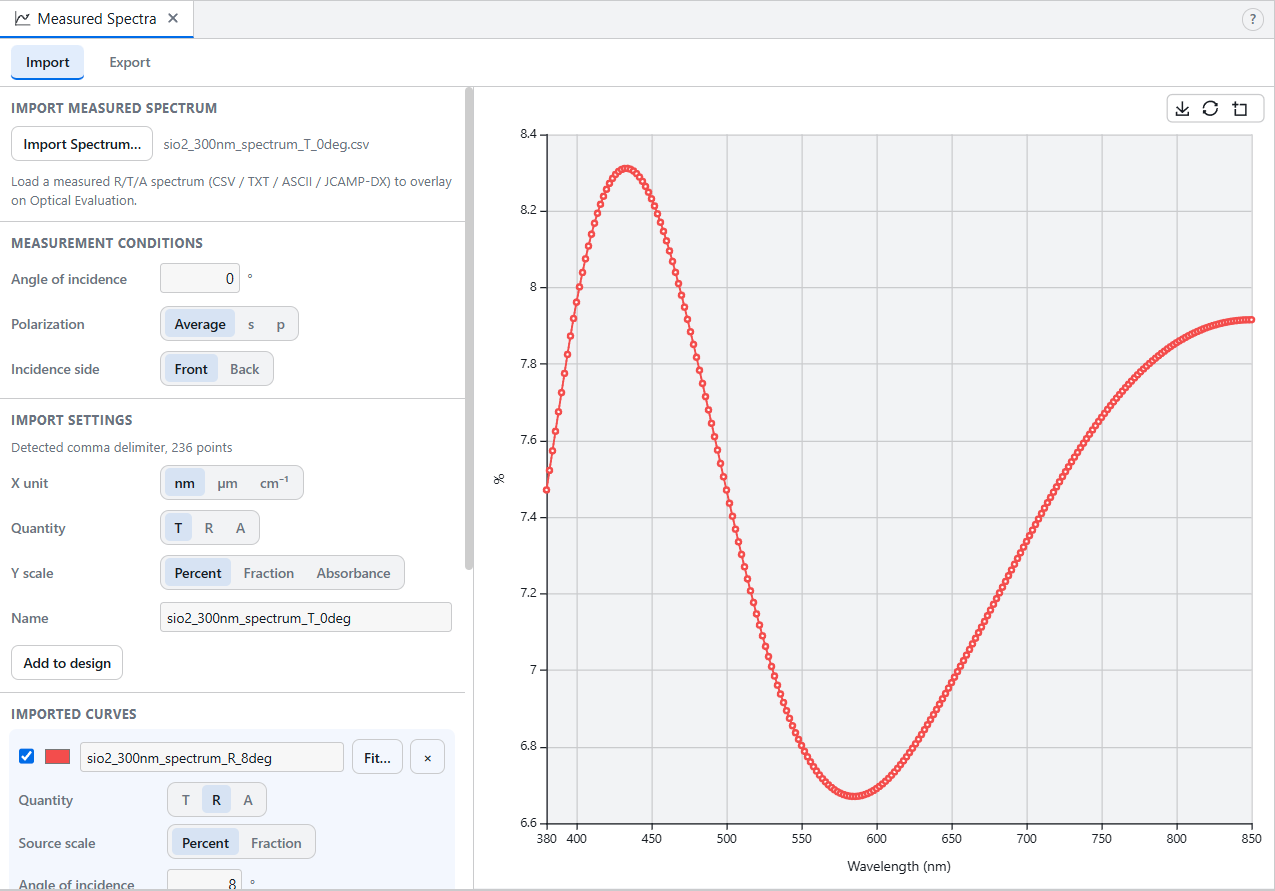
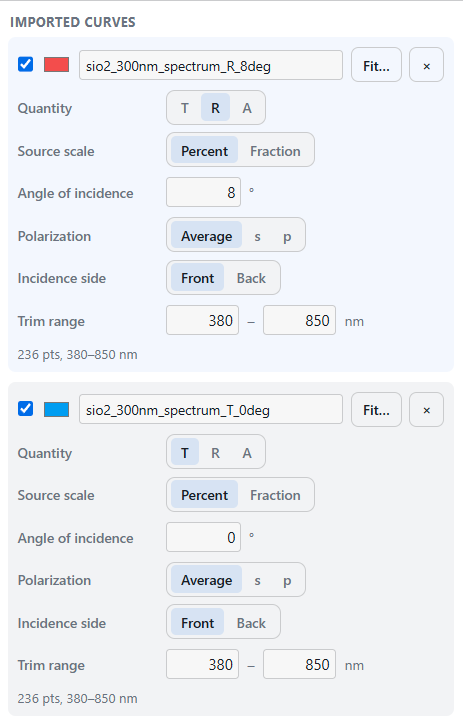
Each curve carries its own angle, polarization and illuminated face, and the file almost never states any of them, so if R was taken on a 6 or 8 degree accessory, type that in rather than leaving it at 0. Curves are stored on the design, so you need one open.
Set it up and press Extract

Open Production → Measured data → n,k and pick the two curves.
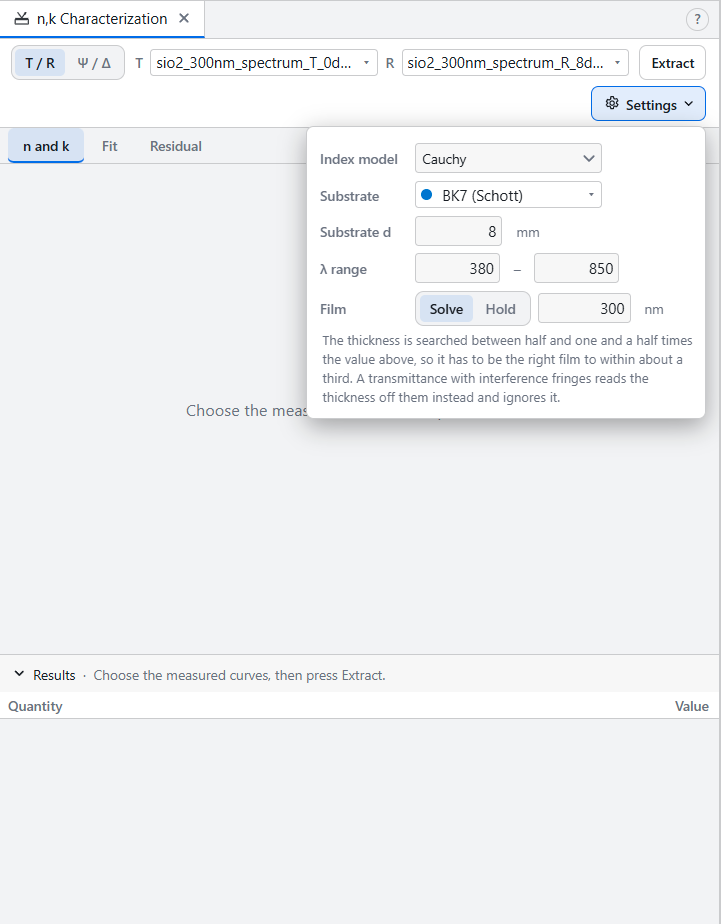
| Setting | What it decides |
|---|---|
| Substrate, Substrate d | The slab under the film. Defaults to the design's substrate. |
| λ range | The part both curves cover, inside the range your substrate data covers. |
| Index model | Cauchy for an oxide or fluoride away from its edge, Sellmeier when Cauchy leaves a shape in the residual, Drude-Lorentz for metals. |
| Film → Solve or Hold | Fit the thickness together with n and k, or hold a thickness you measured another way. |
On Solve, type your best estimate of the thickness. The fit searches a range around it, so the estimate has to be right to about a third; a crystal-monitor reading or a nominal recipe thickness is close enough. If you know the thickness properly, use Hold and let the fit spend everything on n and k.
Press Extract.
Read the result
The n and k tab is the answer: a smooth model, which is what gets saved, with the per-wavelength solutions drawn on top of it.
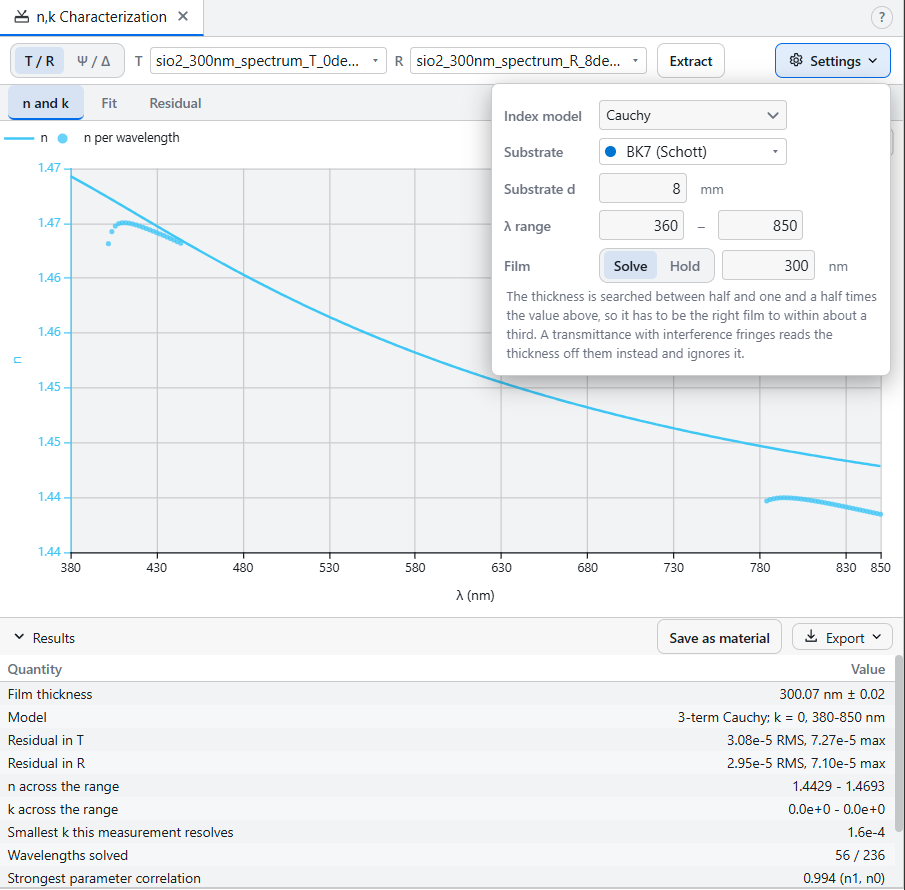
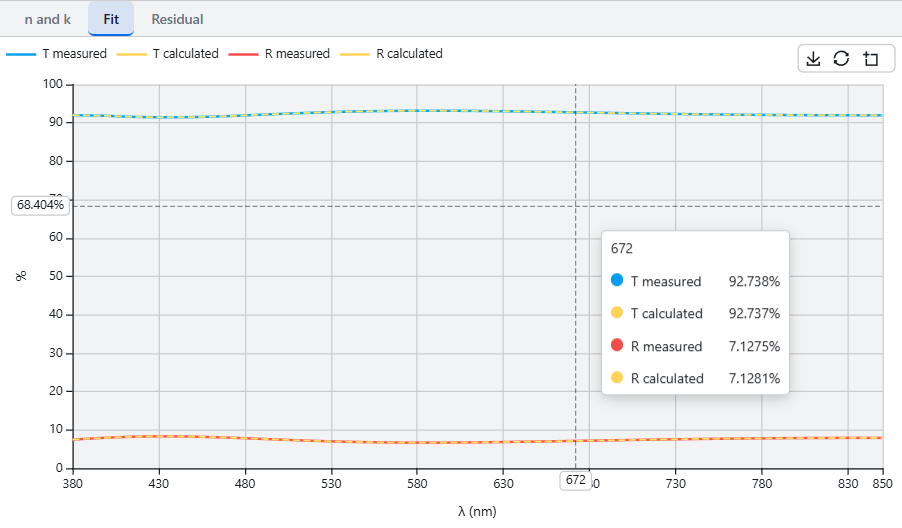
The Fit tab puts your measured curves against the calculated ones, and Residual shows the difference between them.
Now let's take a look at the results table:
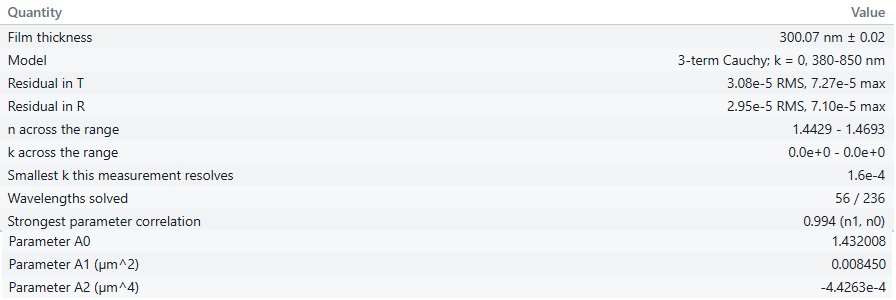
Film thickness - what the fit settled on. The ± is the fit's own spread on that parameter, not your experimental uncertainty.
Residual in T / in R - whether the model reproduces your scans. Fractions here, not the percentage points on the Residual tab, so 3e-5 RMS is 0.003%.
n across the range - the index at the two ends of the band.
k across the range, read with the row under it - zero against a resolvable floor of 1.6e-4 means no absorption this measurement could have seen, not none.
Then the two rows that look alarming and aren't: Wavelengths solved counts the per-wavelength points rather than the model, and correlation near 1 between Cauchy terms is normal, meaning the individual A coefficients are not separately pinned while n(λ) still is.
A0/A1/A2 are the solved coefficients for the Cauchy formula.
A small residual is not proof. Macleod ran a computer experiment on exactly this: transmittance generated from an inhomogeneous film with no absorption, then extracted as though the film were homogeneous and absorbing, reproduced the input data perfectly and returned constants that were not the film's. The only sign of the error was k rising toward long wavelengths, and that is one of the notices this window raises.
R and T summing to more than one is the instrument, not the film.
Save it
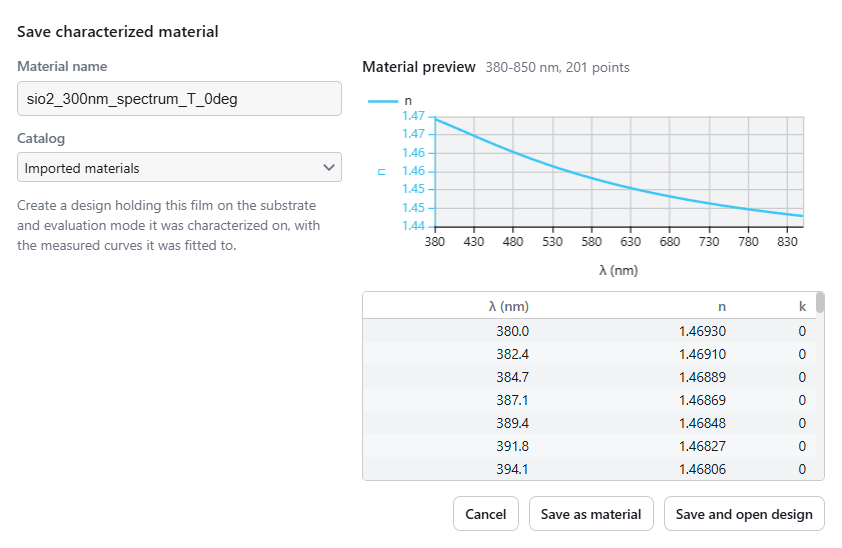
Save as material writes the smooth model into a catalog. Save and open design also builds the fitted sample with the measured curves on it.
Ellipsometry
Two reasons decide it for you.
There is nothing to transmit. A witness on a silicon wafer, on any substrate that is not a polished transparent slab, or a film opaque in your band, leaves the photometric model with no T to fit. The ellipsometric model here is a single reflection off the coated face and assumes no rear reflection, which is what a wafer already is.
Ψ and Δ carry no absolute scale. They are an amplitude ratio and a phase difference. A baseline or 100%-line error of a few tenths of a percent lands in an R/T fit as absorption your film does not have. It does nothing to a Ψ/Δ fit.
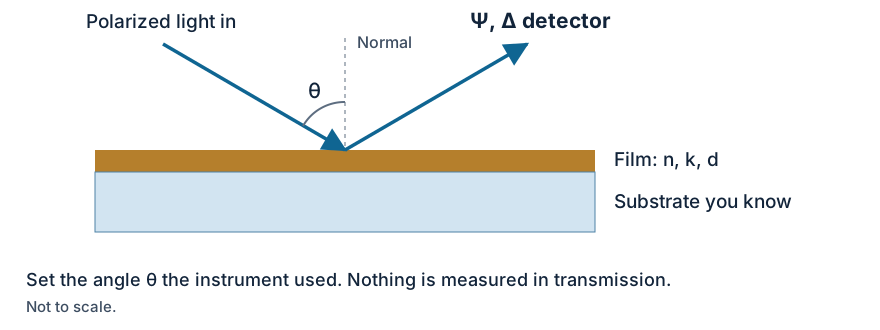

Ψ and Δ import in Production → Measured data → Ψ/Δ, and two settings decide whether the fit means anything. The angle is usually not in the file, so check it against what the instrument used; a pair imported at 0° is refused, because at normal incidence Ψ and Δ carry nothing about the film. The Δ convention sets the sign: if an imported Δ looks like a mirror image of the calculated one, this is the setting to change. The model also assumes nothing comes back off the rear face, so kill that reflection at the sample.
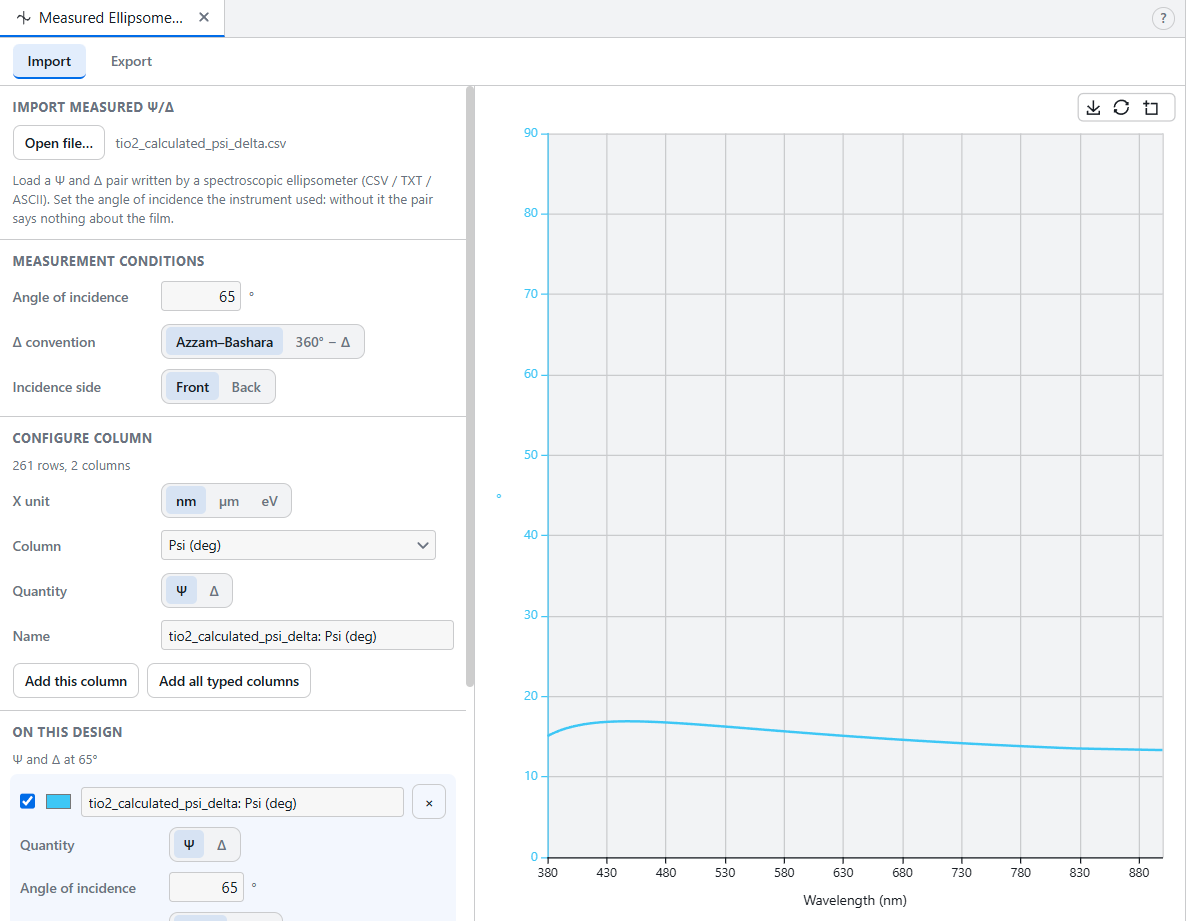
From there it is the same as before: pick the pair, choose a model, Solve, Extract.
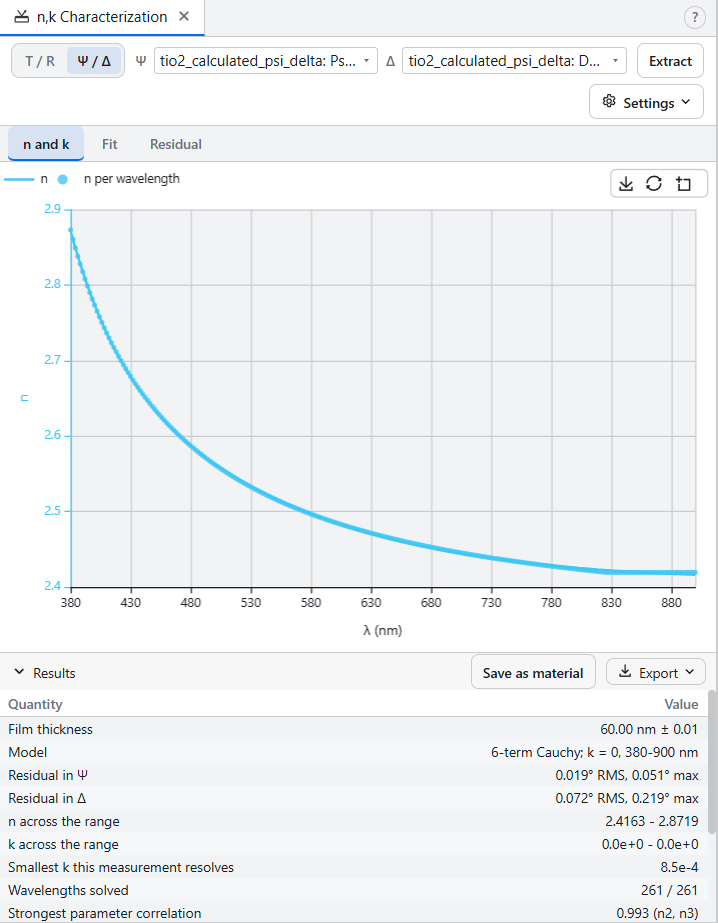
A 60 nm TiO2 film on BK7, read at 65° over 380-900 nm, comes back at 60.00 nm with n = 2.5174 at 550 nm, against the 2.5166 the curves were made from.
It also holds on to thinner films than R and T do, which is a side benefit rather than a reason: if the witness thickness is yours to choose, choose it instead of the instrument. Where that limit sits by material, on BK7 with the thickness fitted:
| Film | n | Thinnest R/T recovers | Thinnest Ψ/Δ recovers |
|---|---|---|---|
| MgF2 | 1.38 | 160 nm | 60 nm |
| SiO2 | 1.46 | 100 nm | 130 nm |
| Ta2O5 | 2.10 | 80 nm | 100 nm |
| TiO2 | 2.45 | 80 nm | 60 nm |
These are empirical: calculated films of decreasing thickness put through the module until the recovered n and thickness stopped matching what went in. Noiseless data, so read them as a best case rather than a specification.
They also move with how you measured. Widening the fitted band recovers thinner films than this column shows, and so does taking R and T at different angles instead of both at normal incidence.
MgF2 is the worst case in the table because its index is so close to the glass. It barely changes the reflectance, so there is very little in R and T to read.
Metals
A metal is the other job for the ellipsometer. An opaque film transmits nothing, so photometry is left with R alone, which is one equation for two unknowns and cannot separate n from k. Ψ and Δ still work at any thickness.
Here is 100 nm of silver on BK7, read at 65°.
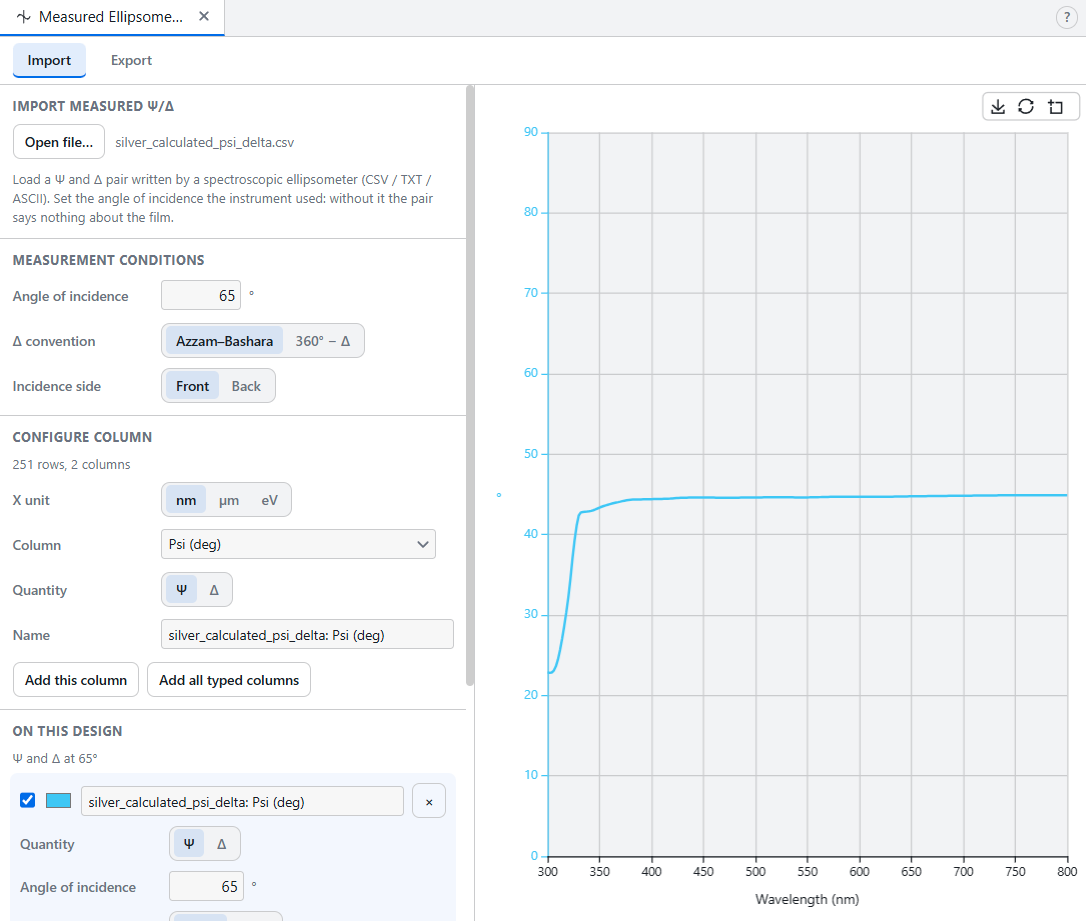
Two settings change from the dielectric case.
Index model → Drude-Lorentz. It is the only metal model offered, and it does not need to be narrowed down: it covers the free electrons and any absorption bands sitting on top of them, and takes the oscillator count from your data. Silver uses two across the visible. A film with no band in range uses none, and the results table then says Drude, because that is what it fitted.
Film → Hold. Across a band where the metal is opaque, the reflection does not change however much more you add, so the thickness is not in the measurement. Solve does not refuse: over 400-800 nm it returned 63.7 nm for this 100 nm film, with no notice attached. The constants come back the same either way.
| Film setting | Thickness returned | k at 550 nm | Residual Ψ / Δ RMS |
|---|---|---|---|
| Hold at 100 nm | held | 3.586 | 0.047° / 0.077° |
| Solve from 100 nm | 63.7 nm | 3.598 | 0.044° / 0.077° |
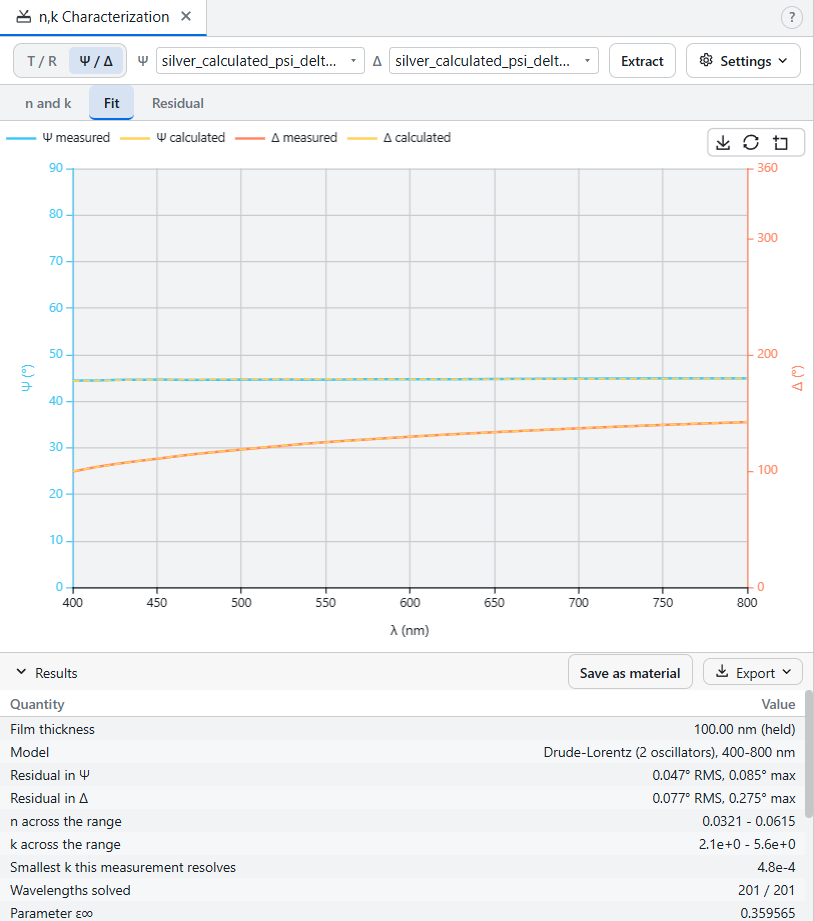
One notice behaves differently here. k rising toward longer wavelengths is the free electrons doing what free electrons do, so the notice that flags it on a dielectric is suppressed for metal fits.
References
- H. A. Macleod, Thin-Film Optical Filters, 5th ed. "Measurement of the Optical Properties" for envelope methods and why reflectance fringes alone must not be used to extract k, Figure 14.13 for the spurious rising extinction coefficient, and §5.1.1 for the free-electron behaviour of metals.
- n,k Characterization for the window's settings, notices and results table.
- Measured Spectra and Measured Ellipsometry for importing the curves, and Spectrum File Formats for what your instrument writes.